Bingie Residents Association Rainfall Recording
The BRA continue to keep a detailed rainfall record (partly for the water quality program, which we manage). Our record goes back for 21 years at the end of 2017 and we can correlate this with the BOM record at Moruya airport (a good correlation) .
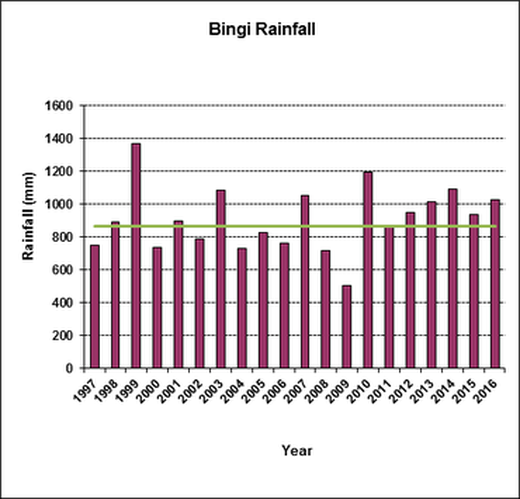
The above graph is a summary of the Bingie rainfall record and comparison with Moruya Heads Pilot Station record. The green line is the average.
|
RAINFALL VARIABILITY IN A 40 YEAR RECORD FROM BINGIE
As the rainfall chart shows, over the last 39 years annual rainfall in Bingie has varied greatly year to year. Most of this variability can be explained by the influence of ENSO events ( El Niño and La Niña) and the Millennium Drought. Descriptions of these events summarised below were taken from the Bureau of Meteorology website. El Niño events are often associated with drier than normal, and La Niña events with wetter than normal, conditions across eastern Australia. In Bingie there was generally a close correlation, with some notable exceptions, between rainfall and ENSO events From late 1996 to mid-2010, much of southern Australia experienced a prolonged period of dry conditions, known as the Millennium Drought. The drought conditions were particularly severe in the more densely populated southeast and severely affected the Murray-Darling Basin and virtually all of the southern cropping zones. The Bingie record clearly shows the effects of this drought with rainfall being below average in 11 of the 14 years of its duration. |
Over the 39 period of the Bingie records the average rainfall was 937 mm, with the wettest year being 1989 (1484 mm) and direst 1982 (416 mm). Over the same period the average rainfall at the MHPS, 12 km to the north, was the same as at Bingie – 937 mm – and 1989 and 1982 were the wettest and driest years were also the same.
The MHPS record extends back 142 years to 1876 and over that period the average rainfall was 955 mm, the wettest year 1934 (1822 mm) and the driest year 1982, as already noted.
Relationship with El Niño (EN) and La Niña (LN) events
1982 EN. This had a very strong impact in SE Australia (SEA), hence the record dry 1982 in Bingie, with only 415 mm of rain, and at the MHPS. 1980, another very dry year (430 mm), was not associated with an El Niño.
1987 EN, followed by 1988-89 LN. Weak EN impact in SEA, followed by a strong LN with very wet conditions. 1987 was pronounced dry year in Bingie and 1988 and 1989 were very wet, with 1989 being the wettest year in this 40 year record. Exceptionally heavy rain was recorded in April in 1988 (384 mm) and 1989 (391 mm).
1991 EN. Variable impact in SEA with generally dry conditions but wet mid year and a very wet December. A much wetter than average year in Bingie.
1993-94 EN. Very weak impact over much of NSW, with record rain in the second half of 1993 (brought on by Bob Hawke’s election as PM) and early 1994. In Bingie 1993 was drier than average.
1994-95 EN. Variable impact in SEA with dry conditions throughout most of 1994, wet November to January 1995, then dry February-April. As a consequence annual rainfall at Bingie in these two years was about average.
1997-1998 EN, then 1998-2001 LN. The EN had a strong impact on SEA and in Bingie 1997 was dry (as was the previous year). The following LN had a moderate to weak impact in the south of the country and at Bingie, except for high rainfall in 1999, rainfall remained a little below average. In January 1999 there was over 680 mm of rain (more than the total in some years), mainly from an extreme rainfall event on 28-29 January when over 500 mm of rain fell in a 24 hour period.
2002-03 EN. This event had a very severe drying impact in SEA, one of which was the 2003 Canberra fire. At Bingie 2002 was drier than average.
2006 EN. This has a very strong impact in SEA because the region never experienced a return to wet conditions after the 2002-03 EN. This was a dry year at Bingie.
2007-08 LN, then 2008-09 LN. These events provided some very temporary relief from drought conditions in parts of SEA. Bingie had above average rainfall in 2007 but not in 2008 and 2009. With only 500 mm of rain, 2009 was one of the driest years recorded here.
2009-10 EN, then 2010-12 LN. The EN was a weak event in SEA and was followed by a moderate to strong LN event which broke the Millennium Drought with extensive floods in SEA in late 2010 and early 2011. At Bingie, following the breaking of the drought, 2010 had well above average rainfall. In January 2010 there was over 550 mm of rain, mainly from another extreme rainfall event on 16-18 February when over 350 mm of rain fell in a 36 hour period.
Since 2010 annual rainfall has been about average.
The database
The graph is based on the compilation and averaging of three rainfall records, from north to south: 1979-2013 by Steve Young, Alcheringa Lane; 1997-2017 by Philip Hughes and Marjorie Sullivan, Bingie Road, and 1997-2017 by Huon Hassall, Kellys Lane. For the timespans they overlap the average rainfall values are within 3% of each other, although the values recorded for individual years in the three sets of records from 1997 vary by up to 11%. Monthly and daily values are even more variable, not just between these three sets of records, but between these and those kept by various members of the water quality sampling team. The main reason for this is that the intensity and duration of rain from storms that cross the district varies greatly over short distances.